ESG benchmarking shows you where you stand before your customers ask.
See how your sustainability performance compares to industry peers across EcoVadis, CDP, and GHG emissions, so you know what to fix before it costs you.
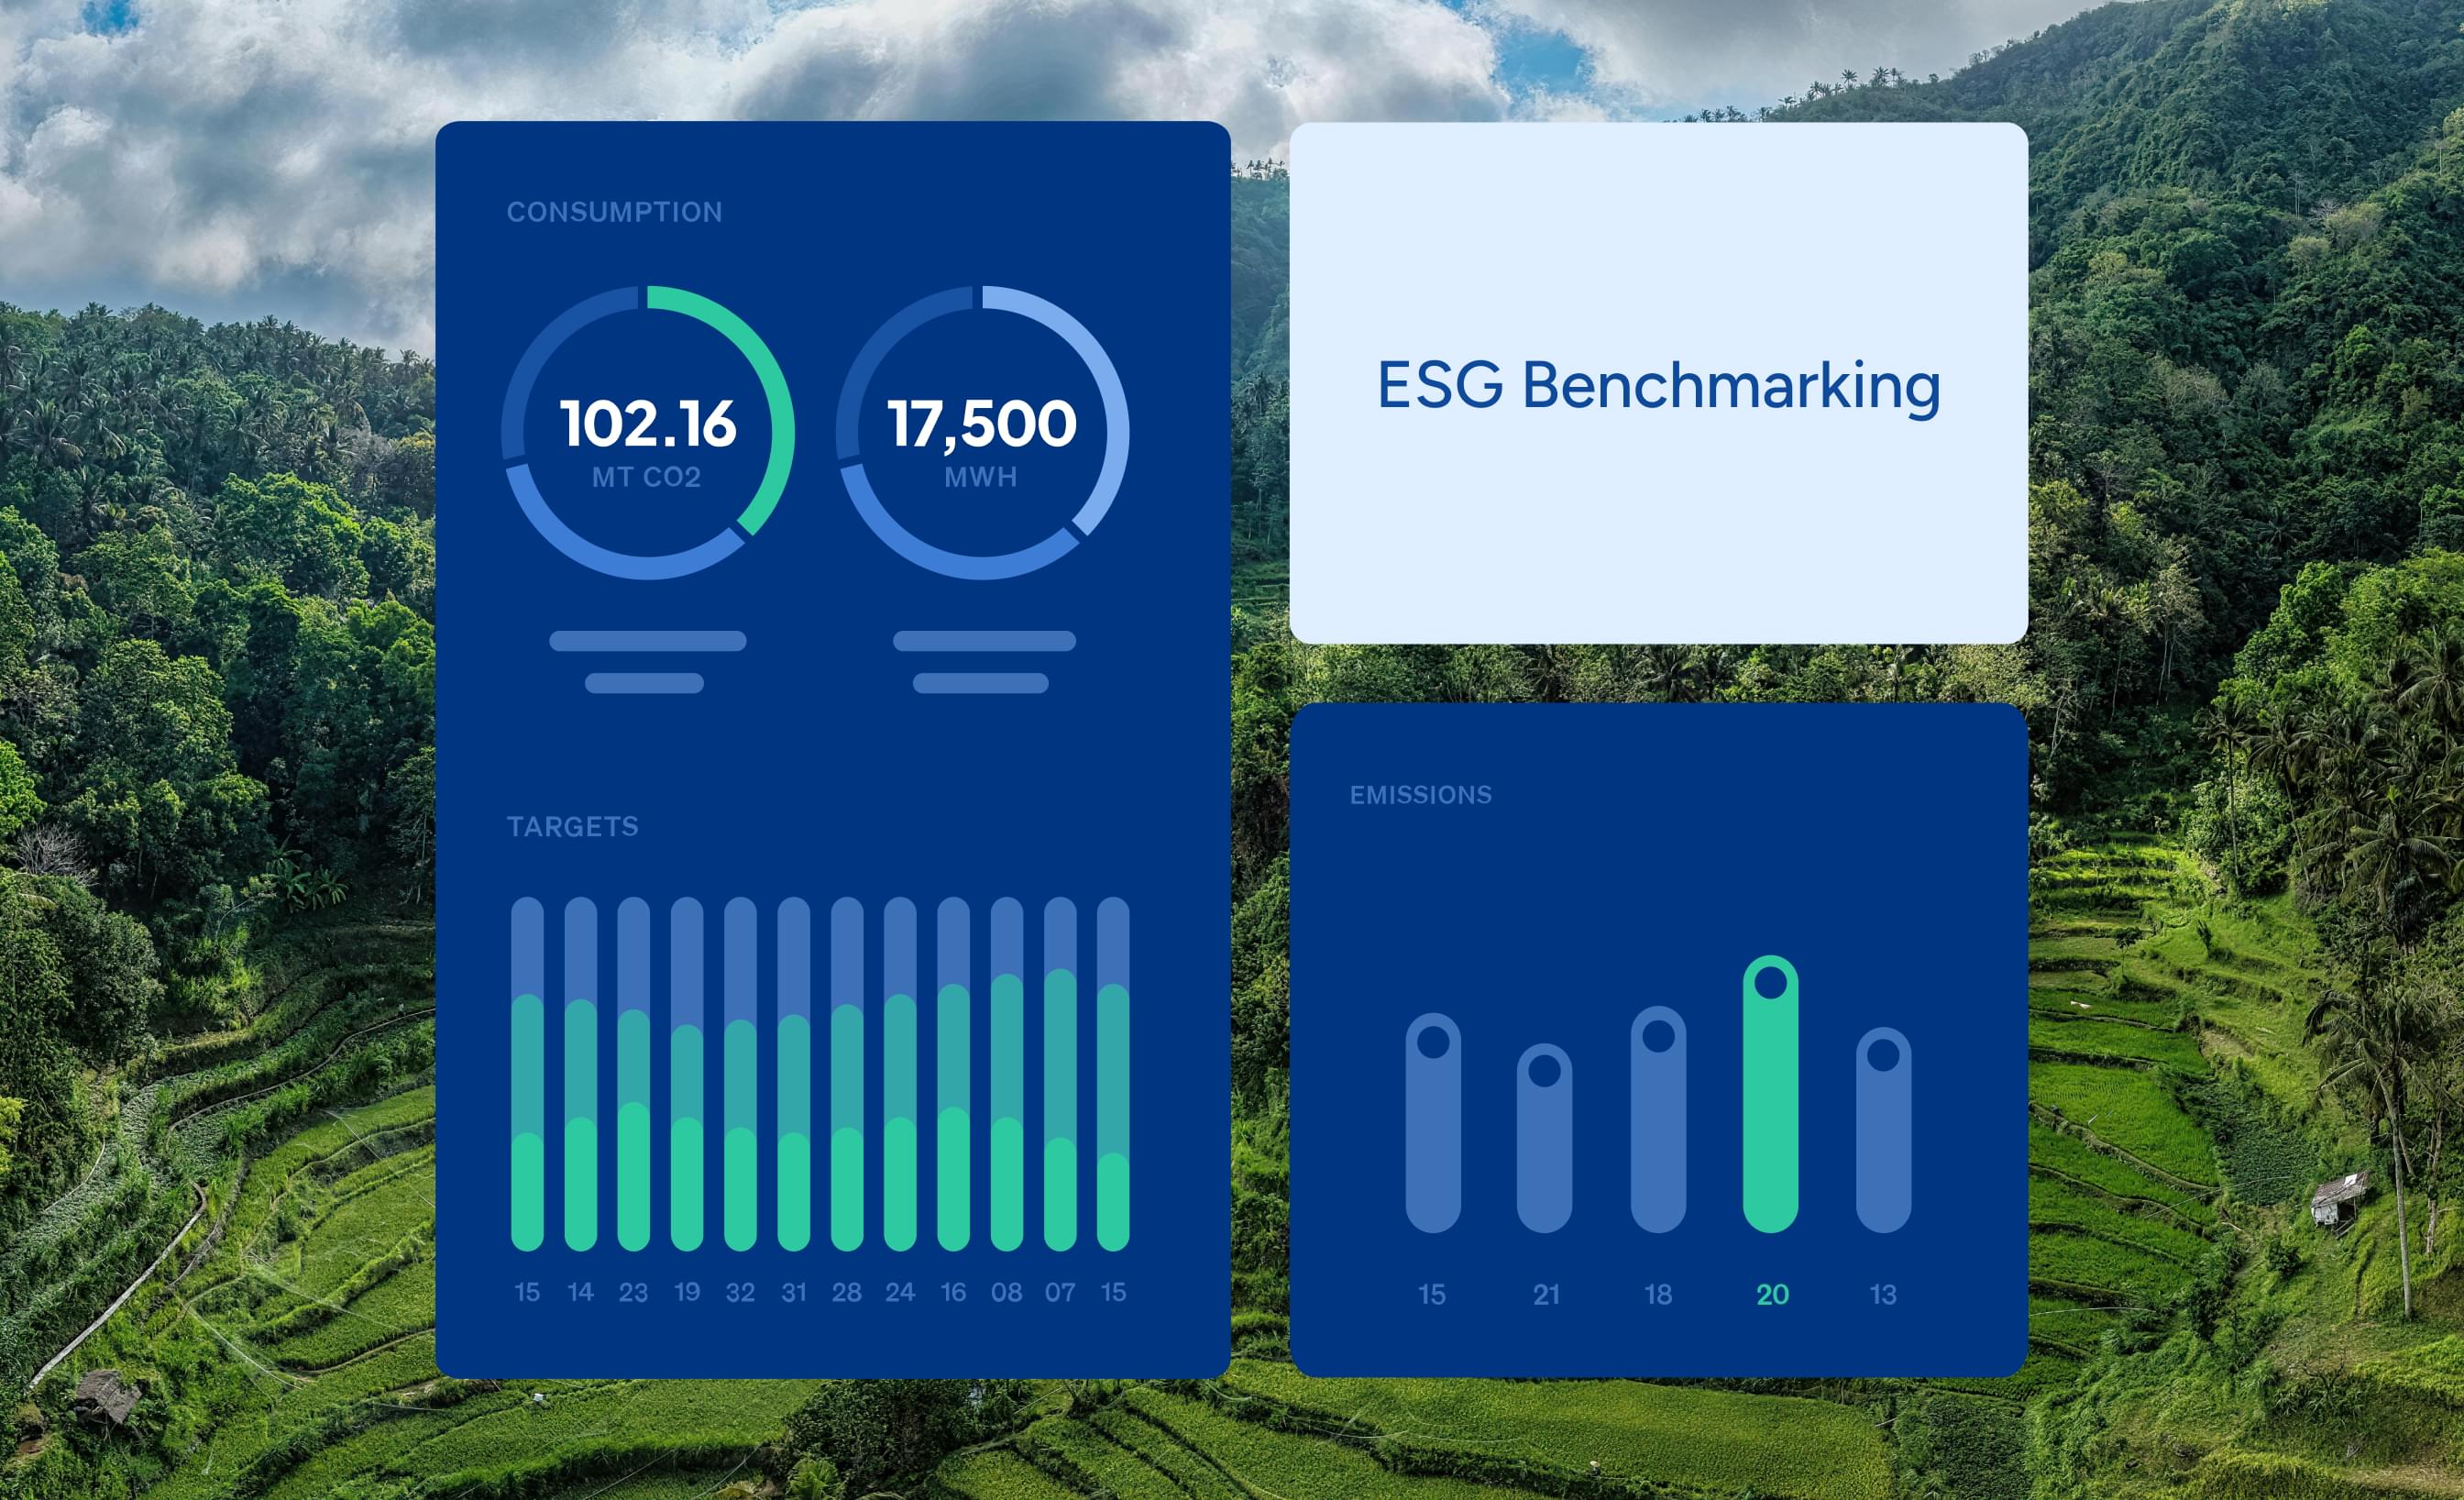


What you'll see when we run your benchmarking comparison
An ESG performance benchmarking comparison against a broad dataset of industry peers, covering the metrics your customers and regulators already use to evaluate you.
Where your EcoVadis score stands
See how your rating compares to industry peers and top performers — so you know exactly where you sit in the rankings buyers and procurement teams already use.
CDP disclosure gaps in your sector
Find out which disclosure gaps are most common among companies like yours, and how yours compare before regulators or customers ask.

Your GHG emissions profile, benchmarked
Understand how your Scope 1, 2, and 3 emissions compare to peers by category — and where the gaps are widest.
What competitors are doing differently
See where peers are pulling ahead and the specific practices driving their performance — so you can close the gap with a clear direction.


12% per year average reduction
Companies with validated SBTi targets reduced their Scope 1 and 2 emissions by an average of 12% per year between 2020 and 2023, meaningfully ahead of the pace required to meet 1.5°C pathways. Credible targets aren't just paperwork. They drive real reductions.
Long heading is what you see here in this feature section
Learn more about our approach to emerging regulations and including SB 261, SB 263 and complete mandatory reporting with ease.